


- 1 Create and manipulate basic shapes like rectangles, circles, and lines using the Canvas API.
- 2 Enhance graphics with styles, gradients, patterns, and transformations such as rotation and scaling.
- 3 Build interactive animations and handle user input with event listeners for a dynamic canvas experience.
The HTML5 Canvas API is a powerful tool for producing 2D and, via WebGL, 3D graphics directly in the browser. With JavaScript, it can power everything from games to data-visualization tools and drawing apps. This guide covers the basics from creating your first canvas, to drawing shapes, to managing animations.
1. Setting Up Your First Canvas
The canvas element is an HTML element which acts like a container of graphics. Getting started with the use of the canvas element requires you to create the canvas in the HTML file itself.
Example:
<body>
    <canvas id="myCanvas" width="500" height="500"></canvas>
    <script>
        const canvas = document.getElementById('myCanvas');
        const ctx = canvas.getContext('2d');
    </script>
</body>
Explanation:
- The <canvas> element is added to the HTML document.
- The getContext(‘2d’) method is implemented to generate a 2D rendering context. All the drawing operations are done with the help of this context (ctx).
2. Drawing Basic Shapes
Some of the more basic drawing methods for rectangles, lines, circles etc are defined
Some of the most used:
2.1 Drawing Rectangles
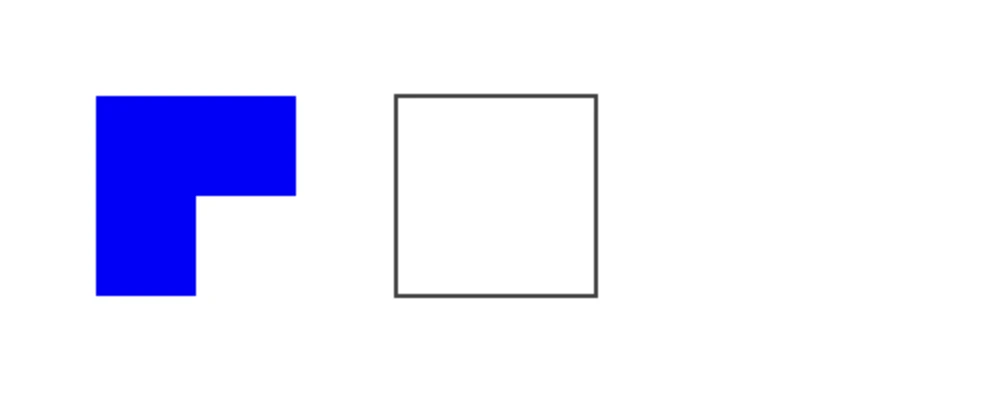
- fillRect(x, y, width, height) – Draws a filled rectangle.
- strokeRect(x, y, width, height) – Draws the outline of a rectangle.
- clearRect(x, y, width, height) – Clears a rectangular section of the canvas.
Example:
ctx.fillStyle = 'blue';  // Set fill color to blue
ctx.fillRect(50, 50, 100, 100);  // Draw a blue rectangle
ctx.strokeRect(200, 200, 100, 100);  // Draw the outline of a rectangle
ctx.clearRect(100, 100, 50, 50);  // Clear part of the canvas
2.2 Drawing Lines
You have to follow these steps in order to draw a line:
- Start a new path by calling beginPath().
- Move the “pen” to the start point by calling moveTo(x, y).
- Draw the line to the endpoint by calling lineTo(x, y.
- Finally, call stroke() to draw the actual line.
Example:
ctx.beginPath();
ctx.moveTo(50, 50);
ctx.lineTo(200, 200);
ctx.stroke();  // Draw the line

2.3 Drawing Circles and Arcs
To draw arcs or circles, use the arc(x, y, radius, startAngle, endAngle) method.
Example:
ctx.beginPath();
ctx.arc(250, 250, 50, 0, Math.PI * 2);  // Full circle
ctx.fill();  // Fill the circle

3. Working with Colors and Styles
You can change the appearance of the shapes by modifying the fill and stroke colors, gradients and patterns, respectively.
3.1 Fill and Stroke Colors
- fillStyle fills the color to shapes.
- strokeStyle strokes the outline of shapes.
Example:
ctx.fillStyle = 'red';
ctx.strokeStyle = 'green';
ctx.lineWidth = 5;
ctx.fillRect(20, 20, 100, 100);
ctx.strokeRect(150, 20, 100, 100);

3.2 Gradients
Canvas supports both linear and radial gradients for smooth transitions in color.
Linear Gradient Example:
let gradient = ctx.createLinearGradient(0, 0, 200, 0);
gradient.addColorStop(0, 'blue');
gradient.addColorStop(1, 'white');
ctx.fillStyle = gradient;
ctx.fillRect(10, 10, 200, 100);

3.3 Patterns
You can also use images as patterns with createPattern(image, repetition).
Example:
let img = new Image();
img.src = 'https://placehold.co/400';
img.onload = function() {
    let pattern = ctx.createPattern(img, 'repeat');
    ctx.fillStyle = pattern;
    ctx.fillRect(50, 50, 400, 400);
};
4. Transformations
Canvas allows you to perform various transformations like scaling, rotating, and translating the canvas.
4.1 Translating
The translate(x, y) function translates the canvas and its origin to another point.
Example:
ctx.translate(100, 100);
ctx.fillRect(0, 0, 50, 50);  // Now (0, 0) is at (100, 100)

4.2 Rotating
The rotate(angle) function rotates the canvas by the given angle in radians.
Example:
ctx.rotate(Math.PI / 4);  // Rotate 45 degrees
ctx.fillRect(300, 0, 50, 50);

4.3 Scaling
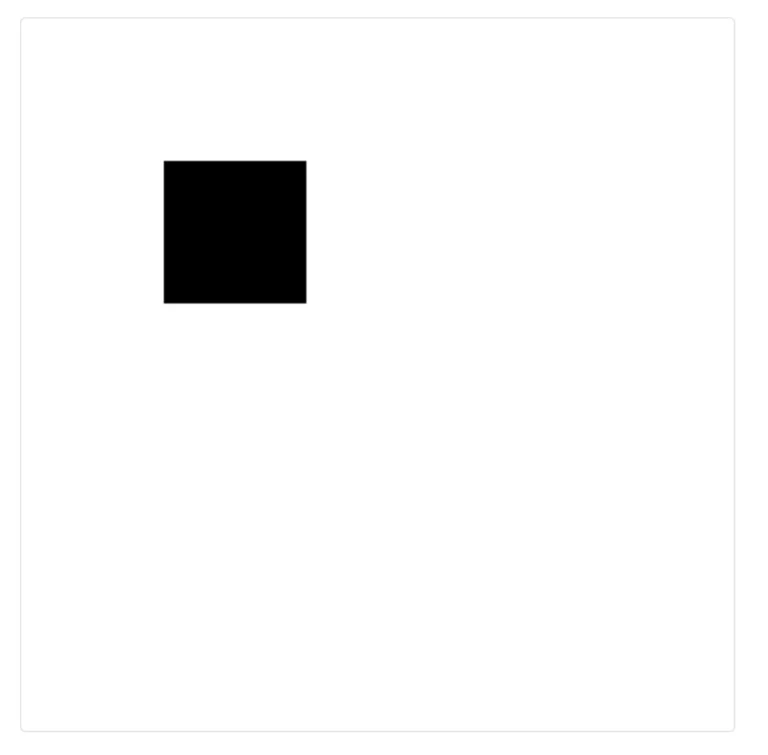
The scale(x, y) function scales the canvas to x times horizontally and to y times vertically.
Example:
ctx.scale(2, 2);  // Scale both dimensions by 2
ctx.fillRect(50, 50, 50, 50);
5. Images and Text
You also draw images and text onto the canvas.
5.1 Drawing Images
The drawImage(image, x, y) function paints an image onto the canvas.
Example:
let img = new Image();
img.src = 'path/to/image.jpg';
img.onload = function() {
    ctx.drawImage(img, 50, 50);
};

5.2 Drawing Text
The Canvas API also renders text.
- fillText(text, x, y) draws filled text.
- strokeText(text, x, y) draws outlined text.
You can define font and size through the font property.
Example:
ctx.font = '30px Arial';
ctx.fillText('Hello Canvas', 100, 100);

6. Animations and Interactivity
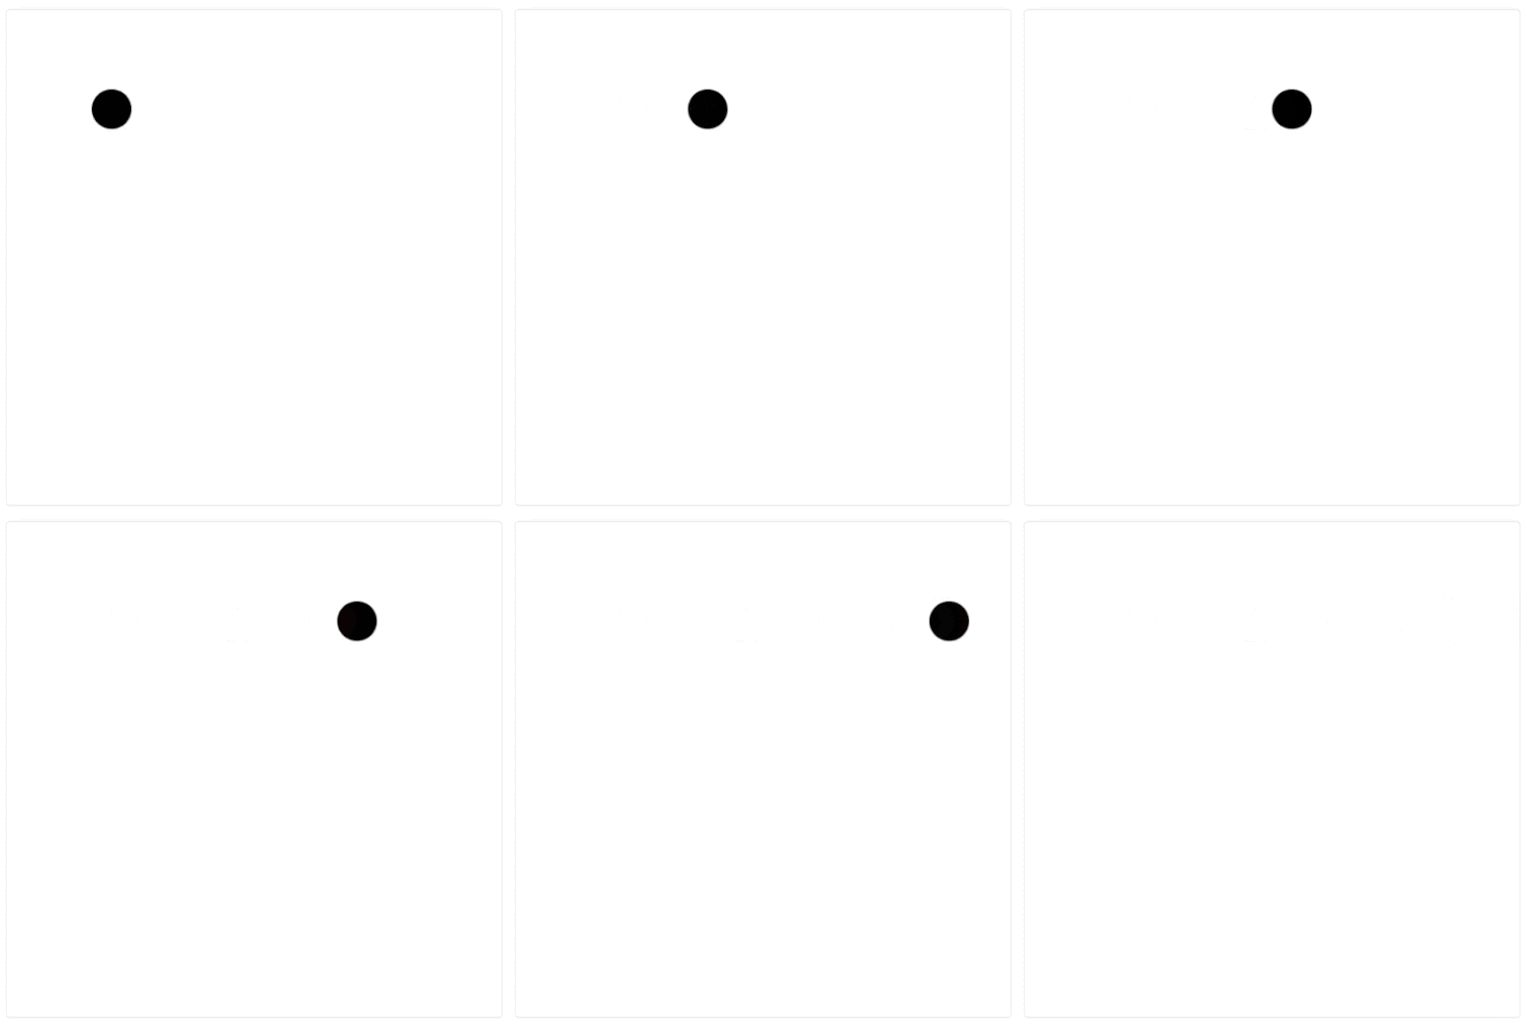
The graphics on a canvas are animated by redrawing the graphics in rapid succession – usually with the requestAnimationFrame() function in order to make it smooth.
6.1 Creating Animations
To create an animation, you do the following:
- Clear the canvas.
- Update the object’s position.
- Draw the object.
Example: A Moving Circle
let x = 0;
function animate() {
    ctx.clearRect(0, 0, canvas.width, canvas.height);  // Clear the canvas
    ctx.beginPath();
    ctx.arc(x, 100, 20, 0, Math.PI * 2);  // Draw the circle
    ctx.fill();
    x += 2;  // Move the circle
    requestAnimationFrame(animate);  // Animate
}
animate();
6.2 Handling User Input
You can give the canvas the chance to be interactive by listening for user events such as mousemove, mousedown, and click.
Example: Drawing on Canvas
let isDrawing = false;
canvas.addEventListener('mousedown', () => isDrawing = true);
canvas.addEventListener('mouseup', () => isDrawing = false);
canvas.addEventListener('mousemove', draw);
function draw(event) {
    if (!isDrawing) return;
    ctx.lineTo(event.clientX, event.clientY);
    ctx.stroke();
}

7. Saving and Exporting the Canvas
Additionally, you can save the contents of a canvas as an image by using the method toDataURL().
Example:
let dataURL = canvas.toDataURL();
Use this dataURL to save the canvas as an image file or upload it to a server.
Common Performance Pitfalls When Working with Canvas
Canvas gives you a lot of freedom. That same freedom makes it easy to write code that works fine with a handful of shapes and falls apart once you’re animating anything complex.
A few mistakes come up often enough to be worth knowing before building something more ambitious than a static drawing.
Redrawing more than necessary is probably the most common one. Every frame in the animation loop above redraws the entire canvas. That’s fine for a single moving circle, but it gets expensive fast once a scene has dozens or hundreds of objects.
When only part of the canvas actually changes between frames, clearing and redrawing just that region with clearRect — rather than the whole canvas — can meaningfully cut down on wasted work.
Creating objects inside the animation loop is another habit worth avoiding. It’s tempting to build a gradient, an Image object, or a complex path fresh on every frame, but object creation isn’t free. Doing it sixty times a second adds up fast.
Setting up gradients, images, and paths outside the loop, then referencing them inside it, keeps each frame doing only the drawing work it actually needs.
Not accounting for device pixel ratio shows up as blurry graphics on high-density screens rather than as a performance issue, but it trips up a lot of beginners. A canvas set to width="500" renders at 500 pixels on a standard display but looks soft on a Retina or similar high-DPI screen.
The fix: scale the canvas’s internal resolution to match window.devicePixelRatio, and adjust your drawing coordinates accordingly. It’s a few lines of setup for a noticeable visual improvement.
Layering too much on a single canvas can become its own bottleneck. For scenes with a static background plus a few actively animated elements, splitting the work across multiple stacked canvas elements helps — one canvas for the background, drawn once, and another for the moving pieces, redrawn every frame.
That way you’re not repainting static content that never changes. It’s a pattern worth reaching for once a project grows past simple examples like the ones covered here.
Canvas API vs. SVG: Choosing the Right Tool
Canvas isn’t the only way to create graphics in the browser. It’s worth knowing where SVG fits, since Canvas and SVG are built around very different models.
Canvas is essentially a bitmap. Once you draw something, Canvas doesn’t remember it as an object — it only keeps pixels. This makes Canvas ideal for situations where many elements change often, like particle effects, games, or data visualizations with thousands of points, since the browser doesn’t need to track each shape as an entity in the page structure.
SVG stores every shape as an element in the DOM. That means each shape can be styled with CSS, targeted by its own event listeners, and inspected in dev tools like any other HTML element. SVG works well for interfaces with a manageable number of elements — icons, charts, or diagrams with a few data series — where individual pieces need their own click handler or hover state.
Once the number of elements grows large, though, SVG performance suffers, since the browser treats each shape as its own item in the DOM tree. Canvas handles that case better, since it draws directly to a bitmap with no per-element overhead. That makes Canvas faster for large amounts of data or many moving parts.
The tradeoff: Canvas requires you to implement things like hit detection manually for click events, since it has no built-in concept of separate clickable shapes the way SVG does.
Which to choose depends on two things: how many elements you’re drawing, and how interactive each one needs to be. A dashboard with a dozen charts usually fits better with SVG. A real-time visualization showing thousands of moving data points usually works better with Canvas.
Building a Simple Canvas Game: Putting It All Together
The pieces covered so far — shapes, animation loops, event listeners — come together most clearly when combined into something interactive, like a small game. It’s a useful exercise for seeing how these building blocks actually fit, rather than working with them in isolation.
A basic paddle game starts with the same canvas and context setup covered earlier. From there, you need to track a few things: where the ball is, how fast it’s moving, where the paddle is, and maybe a score or an end-game condition. This state lives in regular JavaScript variables outside the animation loop. Each frame reads those values, updates them if needed, and draws everything based on the current state.
Collision detection is one of the genuinely new ideas in a game like this. Checking if the ball hits a wall is straightforward — compare the ball’s x position plus its radius to the canvas width. If it goes past that boundary, flip the velocity. Checking the paddle works similarly: see if the ball’s position overlaps the rectangle representing the paddle. For something this simple, you don’t need a physics library — just a few conditional checks running once per frame.
Handling keyboard or mouse input to move the paddle follows the same event listener pattern used earlier for drawing on canvas, just applied to different events. Listen for keydown and keyup to track whether a left or right key is held, then adjust the paddle’s x position accordingly inside the animation loop. This keeps movement feeling smooth, rather than jumping in fixed increments per keypress.
Game state transitions — winning, losing a life, restarting — are worth handling explicitly, rather than letting the animation loop run forever unconditionally. A simple boolean flag like isGameOver, checked at the top of the loop, is often all you need to stop calling requestAnimationFrame once the condition is true. A restart button can then reset the relevant state variables and kick the loop off again.
None of this requires much beyond what’s already covered in this guide. A working simple game is really just shape-drawing, the animation loop, and event handling, applied together with a bit of state tracking layered on top — a natural next step once the fundamentals feel comfortable on their own.
Debugging and Optimizing Canvas Applications
Canvas doesn’t come with the same built-in debugging tools as regular DOM elements. You can’t inspect a shape in dev tools the way you’d inspect a div, since, as covered earlier, Canvas is just pixels with no memory of what was drawn. That makes a few debugging habits worth building early, before a project grows complex enough that tracking down a rendering bug becomes genuinely painful.
Log state instead of just staring at the screen. When something doesn’t appear where it should, it’s often quicker to console.log the coordinates, dimensions, or transformation values right before the drawing call than to guess based on what’s on screen. This helps even more once several transformations — translate, rotate, scale — are combined, since the combined effect can be hard to reason about just by looking at the result.
Use the browser’s performance profiler directly, rather than guessing what’s slow. Chrome DevTools’ Performance tab can record a running animation and show exactly where time is being spent per frame — the drawing calls themselves, garbage collection from object creation inside the loop, or something else entirely. This turns “the animation feels choppy” into a specific, addressable bottleneck instead of a vague impression.
Track frame rate directly during development. A basic FPS counter — tracking the time between consecutive requestAnimationFrame calls and updating a displayed number every second or so — gives immediate feedback on whether a change helped or hurt performance, rather than relying on how smooth something subjectively looks.
Isolate drawing logic into small, testable functions. This helps more than it might seem to at first, even though visual canvas output is hard to unit test directly. Separating the math — calculating a new position, checking a collision, computing a gradient’s color stops — from the actual drawing calls means the logic can be tested and verified on its own. It also just makes the code easier to read and modify once an animation loop starts handling more than a couple of objects.
Not every optimization needs to happen upfront. Premature optimization on a canvas project, like anywhere else, can add complexity for a performance problem that never actually materializes. Build the straightforward version first, profile once something feels slow, and then apply specific techniques covered earlier — reducing redraw area, moving object creation outside the loop, splitting static and dynamic content across layered canvases. This tends to produce cleaner code than trying to anticipate every performance issue in advance.
Test across devices earlier than feels necessary, not just on your own development machine. A canvas animation running smoothly at 60 frames per second on a powerful desktop can behave very differently on a mid-range mobile device, where CPU and GPU resources are far more limited. A feature that looks finished and performant during development can stutter noticeably once it’s running on the hardware a real user actually has.
This matters more for canvas work than for typical frontend code, because canvas performance depends directly on how much drawing happens each frame. Testing on a lower-end phone, or using Chrome DevTools to throttle the CPU, often reveals problems faster than waiting for user reports after release. It should be part of any testing routine — this step catches the gap between “it works on my machine” and “it works for everyone,” a gap that’s easy to miss when everything looks smooth on a fast development laptop.
Keep a rough performance budget in mind, rather than optimizing reactively after something already feels slow. Deciding early roughly how many objects, particles, or draw calls a scene needs to support gives you a target to test against as a project grows, instead of only noticing a problem after frame rate has already dropped. It doesn’t need to be formal — even a quick mental check like “this should still run smoothly with a few hundred elements on screen” is usually enough to catch a scaling issue while it’s still small and easy to fix.
This kind of discipline matters more once a project shifts from a personal experiment to something other people actually use. Real users bring a much wider range of devices and conditions to handle — it’s no longer about just one machine. That’s when small habits and consistent practices start to make a real difference.
Conclusion
The Canvas API is a flexible tool for drawing graphics directly in the browser with JavaScript. Once you have a solid grasp of shapes, styles, transformations, and interactivity, you can build anything from a simple sketch to a full game or animation. The key is practice — try different methods and concepts, and you’ll master drawing on the web with Canvas.
To learn more about the Canvas API and its capabilities, check out MDN’s documentation. For more insights and articles, feel free to reach out to us.