


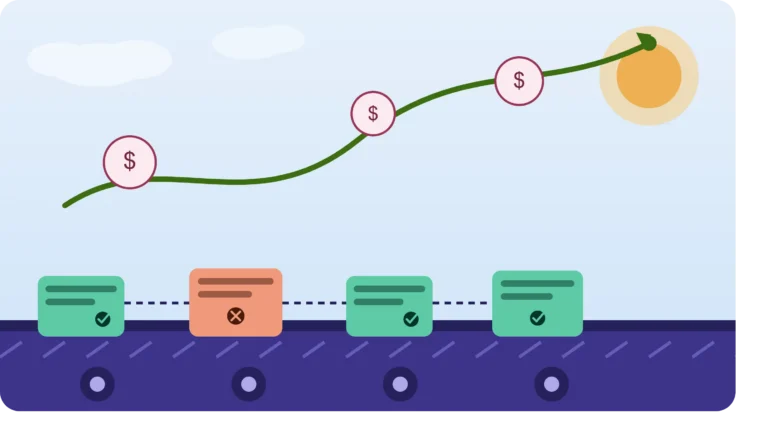
CI/CD pipelines are supposed to save engineering time and catch bugs early — but an unhealthy one quietly does the opposite. Seven signs flag a pipeline that’s losing money: high flaky-test rates, runaway cloud spend on testing infrastructure, slow execution times that stall merges, too much engineer time spent babysitting tooling instead of writing code, false positives that erode trust in the signal, underused tool licenses, and a lack of parallelism. The real fix isn’t a single benchmark spend number — it’s tracking cost per pipeline run, cost per merge, and engineer hours saved, then fixing flakes first, splitting fast/slow test suites, parallelizing aggressively, and auditing tool licenses quarterly. If three or more signs apply, the pipeline is creating more overhead than value.
- 1 A flake rate above 5% should be treated as technical debt — it's the single biggest trust-killer in a pipeline.
- 2 Every pipeline run costs compute, storage, and engineer attention — track cost per run, not just uptime or test volume.
- 3 A 45-minute pre-merge test run stalls engineering velocity; the target is under 15 minutes via aggressive parallelization.
- 4 If keeping automation tooling running requires a dedicated engineer, the wrong tools were likely picked.
- 5 Reflexive reruns instead of investigation is the tell that false positives have eroded trust in the pipeline's signal.
- 6 Audit tool licenses against active users every quarter — paid seats and integrations from finished projects keep billing quietly.
- 7 Serial test suites that could run in parallel shards waste wall-clock time; modern runners handle shard distribution automatically and the setup pays back in about a week.
- 8 There's no universal cost benchmark — the useful comparison is your own cost per run, cost per merge, and engineer time lost, tracked over time.
- 9 If three or more of the seven signs apply, the pipeline is likely creating more overhead than value.
A CI/CD pipeline should save engineering time and catch bugs early. Many pipelines end up doing the opposite: burning cloud spend, blocking merges and generating enough false alarms that engineers stop trusting the output. Test automation was supposed to speed delivery. When the pipeline is unhealthy, it slows it. This post covers seven signs your CI/CD pipeline test automation is losing money, how to spot each one and how to rebuild a test automation strategy that pays back within a quarter.
The ROI of Test Automation in CI/CD
The ROI of test automation in a CI/CD process can look straightforward on a pitch deck and much messier in practice. Every pipeline run costs compute, storage and engineer attention. Test automation adds value when it catches defects early, runs efficiently and keeps alert noise low. Teams often focus on test volume and pipeline uptime, even though both are input metrics. The real measures are defect prevention efficiency and engineer hours saved. These show whether the pipeline is paying off.
High Rates of Flaky Tests
Flaky tests destroy trust in the pipeline. Keep the flake rate visible every week and treat anything above 5% as technical debt that needs attention.

Excessive Cloud Spend on Testing and Automation Tools
Testing and automation tools eat cloud budget quietly. Frequent test runs use compute and stored artifacts keep growing. Measure cost per pipeline run and track how that figure changes as test volume and build frequency increase.
Pipeline Execution Times Are Stalling Engineering Velocity
A 45-minute test run on every PR slows merges and breaks engineering focus. Reduce pre-merge time to under 15 minutes by parallelising aggressively and splitting out slow tests.
Spending More Time on Automation Tooling Than Code
Automation tooling that needs a dedicated engineer to keep running is a sign the wrong tools were picked. Rewriting the testing framework every few months wastes engineering time. A smaller, stable toolset is easier to maintain.
False Positives Are Eroding Trust in the Pipeline
Test automation loses value the moment engineers stop trusting the signal. When failures get reflexively rerun instead of investigated, the safety net is gone. Frequent false positives are a sign that the pipeline needs fixing before the team expands test coverage further.
Underutilized Automation Tooling and License Bloat
CI/CD pipeline tools can become expensive as more licenses are added. Tools purchased for a specific project keep billing after the project ended. Audit tool spend against active users each quarter. Cut what is not in daily use.
Lack of Parallelism in Your Test Automation Strategy
A test automation strategy without parallelism wastes wall-clock time. Serial suites that could run in eight parallel shards run in one. Modern runners handle shard distribution automatically. The setup pays back in a week.
The Seventh Sign: Test Coverage Metrics That Don’t Match Reality
A coverage dashboard showing 85% can conceal a pipeline that does not provide any actual protection. The percentage of coverage is calculated on the amount of code that gets executed during tests, not the amount of code that could detect a problem. A test that runs a function but asserts nothing about its results is contributing to the score and provides no detection capability.
It tends to happen in codebases where coverage was a target rather than a byproduct. Engineers write tests not to inspect behaviors that impact the users but to satisfy a CI gate that blocks merges below a certain threshold. It results in pipelines appearing healthy on a dashboard while still letting defects slip to production: the tests are not designed to detect them, so they do not.
The solution is not to reduce the coverage target. It is to perform regular audits of assertion quality (rather than mere presence) for a sample of the tests, questioning whether they would fail if the implementation they verify were changed in a way that introduces a defect. Pick ten tests from the suite at a random each month and try to break something in them.
The Financial Impact: Calculating the Cost of Inefficient CI/CD Pipeline Test Automation
Inefficient CI/CD pipeline test automation creates costs across infrastructure, tooling and engineering time. The actual amount depends heavily on team size, pipeline frequency, test volume, cloud architecture and the number of engineers affected, so a single monthly benchmark can be misleading. This table shows where the costs typically accumulate and how to measure them in your own environment.
| Cost driver | What affects the cost | How to spot it |
| Runner compute | Number of builds, test duration, runner size and parallel jobs | Track compute cost per pipeline run |
| Storage of artifacts | Artifact size, retention period and number of builds | Review S3 or equivalent storage growth |
| Engineer time on flakes | Team size, flake rate and time spent rerunning or investigating tests | Track rerun rate and engineer hours weekly |
| Tool licenses | Number of seats, environments and paid integrations | Compare vendor contracts with active usage |
| Slow merges opportunity cost | Number of engineers affected and frequency of pipeline delays | Measure wait time between PR readiness and merge |
A 20-person engineering team running a few pipelines a day will have a very different cost profile from a 200-person organisation running hundreds of builds. The useful comparison is therefore your own cost per run, cost per merge and engineer time lost to pipeline failures over time.
How to Optimize Test Automation in CI/CD for Better ROI
ROI from test automation improves fastest when teams fix the biggest sources of wasted time first. Start with flakes. Fix the 10 flakiest tests, then separate fast and slow suites before adding new coverage. Second, run smoke tests on every PR and run the full suite nightly. Third, parallelize the slow suite across shards. Fourth, cache dependencies and test data aggressively. Fifth, audit tool licenses and cut what nobody uses. Sixth, publish a weekly pipeline health dashboard so the number stays visible. Teams that prioritise fixes this way often see lower costs and better trust in the pipeline within a few months.
When to Rebuild the Pipeline vs. When to Repair It
Not all unhealthy pipeline require the same intervention; treating all six or seven signs as equally pressing can lead a team to expensive fixes when a cheaper one would suffice. A pipeline with a high flake rate but reasonable execution time and cloud spend is repaired by addressing only the flaky tests; the rest of the system is functioning fine.
A pipeline exhibiting four or more signs simultaneously (especially with rising tooling costs and execution time) represents a fundamentally different issue, one that requires a more far-reaching revision than incremental fixes. A team that has spent two quarters repairing flakes only to see the rate increase is probably looking at a suite that was never designed to handle the current code base, not one that needs one more round of patching.
The practical test for this principle is whether the same category of issue appears to be recurring following an attempted fix.
Why Innostax Focuses on Lean Automation Tooling for Modern SDLC
Innostax runs test automation programs where automation tooling earns its keep every sprint. Our engineering teams audit existing pipelines, cut the flakes, split fast and slow suites and consolidate tooling to what actually delivers. We track cost per merge and bugs prevented per dollar, and we hold the numbers visible in delivery reviews. If your CI/CD spend has been growing faster than your test coverage returns, talk to us before the next tool renewal.
Moving From Pipeline Expense to Competitive Advantage
A working test automation strategy is a competitive advantage. A broken one is a recurring software development cost. If three or more of these signs apply, the pipeline is likely creating more overhead than value. Fix the flakes, parallelize the suites, audit the tools and rebuild trust in the signal. That work pays back faster than many engineering investments and lasts longer than many tooling upgrades.