


- 1 Sentry helps applications be more reliable by tracking errors in real-time and analyzes performance; thus, it is useful for developers in any field, such as finance or healthcare.
- 2 Adding Sentry into a React application requires use of Sentry package, ensuring it is configured as per environment, and use of error boundary elements to capture errorsWell. Such a design approach helps prevent various errors and allows monitoring the program’s performance effectively.
- 3 The algorithm of monitoring when Sentry is used together with GitHub CI/CD pipelines is integrated and includes building, deploying, and uploading processes for source maps to Sentry, mostly utilizing GitHub Actions for the sake of convenience and improved performance.
Introduction to Sentry
In the dynamic landscape of software development, ensuring the robustness and reliability of applications is paramount. One essential tool that aids in achieving this goal is Sentry, a powerful error tracking and monitoring platform. In this blog, we will explore the integration of Sentry into a React app and the seamless inclusion of its functionalities within CI/CD pipelines on GitHub.
What is Sentry?
Sentry stands out as a leader in the realm of error tracking and performance monitoring. Its capabilities extend beyond mere error detection, encompassing real-time insights into application health and user experience. Whether you are involved in custom financial software development, building an iOS mobile app, or engaged in software development for healthcare, Sentry provides a unified platform for monitoring and optimizing your application’s performance.
Benefits and Uses of Sentry
- Proactive Issue Identification: Sentry’s real-time error tracking allows developers to identify and resolve issues before they impact users, ensuring a seamless user experience.
- Cross-Platform Support: Whether you are focused on cross-platform mobile app development services or specialized in Android apps development, Sentry offers support across various platforms, enhancing its versatility.
- Tailored Solutions for Industries: From banking software development companies to those specializing in healthcare custom software development, Sentry adapts to the unique needs of diverse industries.
- Effective QA Software Testing: Incorporating Sentry into your workflow streamlines the QA process, enabling quicker identification and resolution of bugs and issues.
Implementing Sentry in a React App
Now, let’s delve into the practical steps of integrating Sentry into a React application.
Step 1: Install Sentry Package
Begin by installing the Sentry package using npm:
npm install --save @sentry/react Step 2: Initialize Sentry
Import and initialize Sentry in your application, providing the DSN obtained from the Sentry dashboard.
import { init,  BrowserTracing, Replay} from "@sentry/react";
const STAGING = "staging"

const initializeSentry = () => {
    init({
        dsn: process.env.REACT_APP_SENTRY_DNS,
        environment: process.env.REACT_APP_SENTRY_ENVIRONMENT || STAGING,
        integrations: [
            new BrowserTracing({
                tracePropagationTargets: ["localhost", /^https:\/\/yourserver\.io\/api/],
            }),
            new Replay(),
        ],
        tracesSampleRate: 1.0,
        replaysSessionSampleRate: 0.1,
        replaysOnErrorSampleRate: 1.0,
    });
}

export default initializeSentry
In your React app’s entry point (usually index.js or App.js), import and initialize Sentry:
import React from "react";
import ReactDOM from "react-dom/client";
import "./main.css";
import App from "./App";
import initializeSentry from "./infrastructure/sentry";

const root = ReactDOM.createRoot(document.getElementById("root"));

initializeSentry()

root.render(
  <React.StrictMode>
    <App />
  </React.StrictMode>
);
Step 3: Capture Errors
If you’re using React 16 or a newer version, you can use the Error Boundary component to easily send JavaScript errors that happen inside a group of components to Sentry. This component also lets you show a backup user interface when an error occurs.
import React from "react";
import * as Sentry from "@sentry/react";

<Sentry.ErrorBoundary fallback={<p>An error has occurred</p>}>
  <Example />
</Sentry.ErrorBoundary>;
Monitoring Performance with Sentry
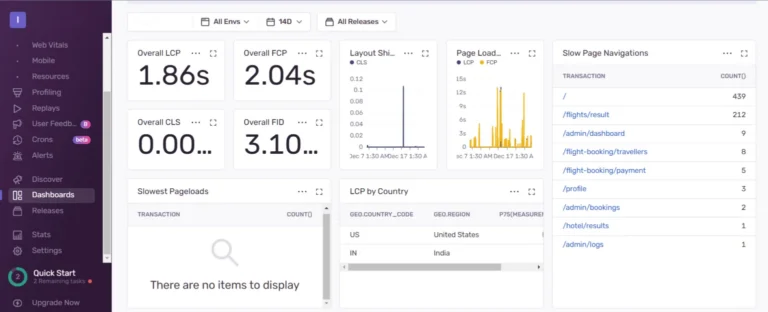
It is important to note that Sentry goes beyond monitoring application errors. Sentry also has the capability of measuring the performance of applications in real-world environments.
Through Sentry Performance Monitoring, programmers are able to measure key performance indicators like page load time, API requests’ duration, navigation performance, and slow transactions. The latter is very helpful for React-based apps since a poorly performing component/API request might affect the general user experience.
For example, developers can use Sentry to identify:
- Slow API requests
- Slow page navigation
- Long-running transactions
- Performance issues in specific components
- Increased response times after a new deployment
It helps the development team find out performance issues that can be optimized through real-time data analysis rather than making assumptions.
Tracking User Context with Sentry
In instances where the production process results in an error, having knowledge of the fact that there is an error is not enough; developers require additional information on the actions performed by the user.
Sentry allows developers to include additional information in the error, including information related to users and tags.
For example, developers can associate an error with a specific user:
Sentry.setUser({
  id: user.id,
  email: user.email,
});
It becomes easy for one to be able to distinguish whether the problem is affecting one individual user, several users or the whole system.
Developers can also add custom tags:
Sentry.setTag(“feature”, “checkout”);
Sentry.setTag(“environment”, “production”);
They can then be used within the Sentry interface to make it easier to search for issues.
Using Breadcrumbs for Better Debugging
One such feature offered by Sentry is breadcrumbs. Breadcrumbs are a sequence of actions that happened prior to an occurrence of any error.
For instance, a user could:
- Launch the application.
- Go to the products screen.
- Select a product.
- Add it to the shopping cart.
- Checkout.
- Error appears.
These actions can be recorded by Sentry as breadcrumbs that provide developers with more details on what occurred before the problem.
This is an efficient way to reduce debugging time since the developers will not have to depend solely on descriptions provided by the users.
Setting Up Alerts in Sentry
Sentry can also be configured to notify development teams when important issues occur.
For example, a team may configure alerts for:
- A sudden increase in error frequency
- New issues appearing in production
- High-impact errors
- Performance degradation
- Errors affecting a large number of users
Notifications help eliminate the need for the developers to continuously check the Sentry dashboard manually.
The developers can then concentrate on development activities while being informed about issues that arise.
Best Practices for Sentry Integration
Sentry Integration Best Practices
Though the integration process is not complicated, there are some best practices that should be followed.
1. Avoid Capturing Sensitive Information
Application might collect sensitive information from users. The developers need to make sure that they understand which information is collected in Sentry and refrain from collecting sensitive data like passwords and payment information.
2. Configure Different Environments
Separate development, staging, and production environments to make issue investigation easier.
3. Use Meaningful Tags
Custom tags such as feature names, application versions, or user flows can make filtering and debugging much easier.
4. Monitor Both Errors and Performance
Failure analysis can be done through error tracking, whereas performance monitoring is used to detect inefficiencies in the application. Together, they make up a better understanding of the application’s state.
5. Connect Errors with Releases
Release tracking helps developers understand whether an issue was introduced by a recent deployment and makes debugging production problems much faster.
6. Configure Alerts Carefully
Too many alerts may lead to unnecessary disturbances. Alerts need to be related to situations that demand immediate action or have some important influence on the user.
Common Problems When Integrating Sentry
There are a few common problems that might occur while configuring Sentry in a React app.
Sentry Events Are Not Appearing
Where there is no presence of the events in the Sentry dashboard, the developers are supposed to check whether the configuration of the DSN is correct or not.
Stack Traces Are Difficult to Read
If production stack traces contain minified files and unreadable line numbers, source maps may not have been uploaded correctly. Checking the build and Sentry release configuration can help resolve this.
Too Many Development Errors
During local development, applications can generate a large number of errors that are not relevant to production monitoring. Configuring environments appropriately can help separate these events.
Missing Context
If an error is difficult to understand, adding breadcrumbs, tags, user context, and additional debugging information can provide more useful information when investigating the issue.
Sentry in the Software Development Lifecycle
Sentry may be included at various points within the software development life cycle, as opposed to its use solely after deployment.
Developers can leverage Sentry during development to discover any unexpected run-time errors.
In QA, they can utilize it to detect problems that arise in the testing phase.
At the deployment stage, Sentry can be integrated into CI/CD processes and release management.
After deployment into the production environment, teams will be able to monitor their application continuously using error tracking and performance monitoring.
With this in mind, Sentry is not only about error reporting.
Sentry Releases and Deployment Monitoring
Sentry provides the ability to track release versions where errors and performance problems can be tied back to particular releases of an application.
This is especially helpful when the issue begins cropping up after a new deployment. The release tracking will help the developers narrow down which version of the software is causing the issue and what was changed within that particular version.
Some of the application releases could be as follows:
v1.0.0
v1.1.0
v1.2.0
If a bug begins appearing following the deployment of v1.2.0, then the developers will be able to use Sentry to determine whether it was introduced by the new release.
Release tracking may assist developers in answering questions such as:
- When was this problem first encountered?
- From which deployment was the problem first discovered?
- Is the most recent deployment causing more problems?
- Is this problem fixed in a later deployment?
This would help gain better insights on how deployment affects application problems and make debugging easier in production.
Handling API and Custom Errors with Sentry
Application failure does not always lead to an exception in JavaScript. For instance, the application may fail in the case of an API call due to an invalid response or server/network problem.
These errors can be manually logged by developers using the Sentry captureException() function.
Example:
try {

  const response = await fetch("/api/users");

  if (!response.ok) {

    throw new Error(`API request failed: ${response.status}`);

  }

  const data = await response.json();

} catch (error) {

  Sentry.captureException(error);

}
Use of the captureException() function helps to report errors related to the application which could be challenging to detect otherwise.
This approach can be useful for monitoring:
- API failures
- Third-party service errors
- Network-related failures
- Business logic errors
- Unexpected application behavior
Programmers can also log their own messages for cases where an event occurs that is significant, although not necessarily an error:
Sentry.captureMessage(“Payment service returned an unexpected response”);
This gives developers more insights into the workings of the applications and allows them to troubleshoot problems which may not have been caught by Sentry.
Sentry Dashboard and Issue Investigation
Once Sentry has been included in a React application, then developers will find the issues reported by the React application through the Sentry dashboard.
In case of an issue within the application, the dashboard will offer helpful details on what was causing the error and where the error originated from.
The information that is readily available includes:
- Error messages and stack traces
- Application version or release
- Browser and operating system
- User information and custom tags
- Breadcrumbs recorded before the error
- Number of times the error occurred
- Environment in which the error occurred
For example, when there is any error that starts cropping up after the application goes live, the developers can create a ticket on Sentry and look at the stack trace, release data, user data, and the breadcrumbs. This gives them more information about the problem they are facing.
Sentry also categorizes similar mistakes into one problem. This prevents the same problem from showing up in different entries and enables one to concentrate on problems that are affecting a larger number of people.
The use of the Sentry dashboard by the developer can ensure that any errors associated with the software are tracked, as well as the analysis of production errors without the need for testing each case manually.
Custom Error Handling with Sentry
In some cases, it is better for developers to capture an error themselves without relying on those errors captured by Sentry itself. It is advantageous to apply this approach in case there is failure or validation of the API.
Sentry provides the captureException() method for this purpose.
For example, an API request can be handled like this:
try {

  const response = await fetch("/api/users");

  if (!response.ok) {

    throw new Error("Failed to fetch users");

  }

  const data = await response.json();

} catch (error) {

  Sentry.captureException(error);

}
For the specific situation that is described above, in case of any failed API request, it will be caught and forwarded to Sentry where the developer can analyze the problem in more detail based on the available context.
The developer can also include more context when capturing the error:
Sentry.withScope((scope) => {

  scope.setTag("feature", "users");

  scope.setLevel("error");

  Sentry.captureException(error);

});
This approach may be particularly helpful in cases where there are several functionalities or API flows in the application. By applying the appropriate tags, it will be easier to determine the source of the problem in Sentry.
Manual reporting of errors is a method which gives more control on deciding whether to report those errors to the programmer or not.
Custom Error Handling with Sentry
In some cases, it is better for developers to capture an error themselves without relying on those errors captured by Sentry itself. It is advantageous to apply this approach in case there is failure or validation of the API.
Sentry provides the captureException() method for this purpose.
For example, an API request can be handled like this:
try {

  const response = await fetch("/api/users");

  if (!response.ok) {

    throw new Error("Failed to fetch users");

  }

  const data = await response.json();

} catch (error) {

  Sentry.captureException(error);

}
In regard to the particular scenario outlined above, if there are any failed requests via the API, these will be detected and then passed to Sentry, and thus the developer will have the ability to troubleshoot the issue in detail.
The developer can also include more context when capturing the error:
Sentry.withScope((scope) => {

  scope.setTag("feature", "users");

  scope.setLevel("error");

  Sentry.captureException(error);

});
This helps to locate the problems relating to a specific feature without having to check all the issues in the project.
The process of setting priorities will ensure that the developer team will deal with those issues that affect the user base more. It is more critical to fix an error that affects hundreds of users who are using the product in production compared to an error that happened once during the development process.
With the use of filters and prioritization, the work with the Sentry dashboard becomes much easier and allows spending more time dealing with important issues.
Integrating with CI/CD Pipelines on GitHub
Efficient CI/CD pipelines are crucial for maintaining a smooth development workflow. Integrating Sentry into your GitHub CI/CD pipeline ensures that every deployment is closely monitored.
Step 1: Configure GitHub Actions
Create a GitHub Actions workflow file (e.g., .github/workflows/main.yml) with the following contents:
name: Dev Build
on:
  push:
    branches:
      - main
  workflow_dispatch:
jobs:
  build:
    runs-on: ubuntu-latest

    strategy:
      matrix:
        node-version: [18.x]

    steps:
      - uses: actions/checkout@v1
      - name: Use Node.js ${{ matrix.node-version }}
        uses: actions/setup-node@v1
        with:
          node-version: ${{ matrix.node-version }}
      - name: NPM Install
        run: |
          npm install
      - name: Dev Build
        run: |
          npm run build
        env:
          REACT_APP_API_URL: ${{ secrets.DEV_REACT_APP_API_URL }}

      - name: Upload Source Maps to Sentry
        run: |
          npm install -g @sentry/cli
          sentry-cli sourcemaps inject ./build
          sentry-cli sourcemaps upload ./build
        env:
          SENTRY_AUTH_TOKEN: ${{ secrets.SENTRY_AUTH_TOKEN }}
          SENTRY_ORG: ${{ secrets.SENTRY_ORG }}
          SENTRY_PROJECT: ${{ secrets.SENTRY_PROJECT }}
Step 2: Set Up Secrets
Navigate to your GitHub repository’s settings and add these secrets:
- SENTRY_AUTH_TOKEN: Obtain from Sentry account settings.
- SENTRY_ORG and SENTRY_PROJECT: Replace with your Sentry organization and project names.
Step 3: Commit and Push
Commit the changes to your repository and push to the main branch. GitHub Actions will trigger the Sentry integration.
Conclusion
With these steps, you have successfully integrated Sentry into your React app and established a streamlined CI/CD pipeline on GitHub. This approach enhances your development workflow, offering real-time insights and proactive issue resolution, making it an invaluable asset for custom software development across various domains. Whether you’re involved in financial software development, healthcare software development, or any other sector, Sentry proves to be a versatile tool in your toolkit.
In conclusion, the integration of Sentry not only elevates the reliability of your React applications but also contributes to the overall efficiency of your development processes, ensuring a seamless user experience in the ever-evolving landscape of software development.
Additional Resources
- Sentry Docs