

- 1 A custom logger in Node. js, done with the help of Winston, improves error logging and discrete event reporting to let developers work using a powerful instrument in favor of applications' error-free and consistent functionality.
- 2 It allows the adaptation of the type of log to the event or the error that arises, which is very relevant in problem-solving, especially in situations such as RESTful API invention and testing.
- 3 The overview of integration of a custom logger is as the following, creating a Node project, installing required Module, creating logger class, and testing with API endpoints, providing a good and solid logger for Node. js applications.
This guide walks through building a custom logger for Node.js applications — a crucial piece of infrastructure for web apps, real-time chat apps, streaming apps, and more.
While working on a personal project, I found myself thinking about how to effectively track errors and event flow in a production environment. That curiosity led me to explore logging more deeply, since logs matter for both debugging and maintaining an application’s overall integrity and performance.
A log file is simply a record of events that happen while an application runs. Each individual record in that file is called a log entry. With that basic understanding in place, I ran into three key questions worth answering. Let’s go through them one by one.
When do we use logs?
Developers adopt various custom logging strategies based on their application’s nature and purpose.
Some common approaches include:
- Logging exclusively during error occurrences or unexpected behavior.
- Logging solely in debug mode.
- Logging in response to specific events.
The selection of a particular approach, or a combination thereof, is a decision left to the developer. In the context of this blog, where the focus is on creating a RESTful API intended for widespread use, I opted for the third approach—logging all significant events.
What do we log?
What you log depends on your application’s specific needs. For a REST API meant for broad use, it’s valuable to log the timestamp, event description, and the content or parameters of each request. This makes it easier to trace logs back to a specific user later.
Consider a common scenario: a user hits an error and contacts you for help. In that case, you typically just need the user ID (if it’s in the request body) and the timestamp to track down the issue.

How can you implement a logger for a Node application?
To implement a logger for your Node.js application, you can leverage popular npm modules such as Morgan, Bunyan, or Winston. Among these, Winston stands out for its ease of use in building custom logs, as illustrated in Figure 2.
Follow the steps below to integrate a custom logger into your Node application. You can skip the initial instruction if you’ve already set up a Node project.
Note: This guide assumes that you have Node installed, have set up VS Code, and configured an npm path.
Now, let’s proceed with the implementation.
1. Create a Node project
To start your Node.js project, create a new folder (I’ve named it “LoggerWinston”). Open the folder in VS Code and execute the following command in the terminal:
npm init
Fill in the prompted details or skip by pressing Enter. Upon completion, the process generates a JSON file named package.json in your folder.
2. Install the required modules
Next, install the necessary modules. Since we’ve chosen Winston for building the custom logger, install it by running the following command:
npm i winston
Additionally, we’ll use Express to construct the API endpoint and the body-parser middleware to access the request body. Install them with the following command:
npm i express body-parser
With these modules installed, you’re ready to proceed with building your custom logger for the Node.js application.
3. Creating the Custom Logger class
Organize your project by creating a “services” folder. Inside this folder, generate a file named “loggerService.js” and copy-paste the provided code:
import winston from 'winston';

const dateFormat = () => {
  return new Date(Date.now()).toUTCString();
};

class LoggerService {
  constructor(route) {
    this.log_data = null;
    this.route = route;
    const logger = winston.createLogger({
      transports: [
        new winston.transports.Console(),
        new winston.transports.File({
          filename: `./logs/${route}.log`,
        }),
      ],
      format: winston.format.printf((info) => {
        let message = `${dateFormat()} | ${info.level.toUpperCase()} | ${route}.log | ${info.message} | `;
        message = info.obj ? message + `data:${JSON.stringify(info.obj)} | ` : message;
        message = this.log_data ? message + `log_data:${JSON.stringify(this.log_data)} | ` : message;
        return message;
      }),
    });
    this.logger = logger;
  }

  setLogData(log_data) {
    this.log_data = log_data;
  }
  async info(message, obj) {
    if (obj) {
      this.logger.log('info', message, { obj });
    } else {
      this.logger.log('info', message);
    }
  }
  async debug(message, obj) {
    if (obj) {
      this.logger.log('debug', message, { obj });
    } else {
      this.logger.log('debug', message);
    }
  }

  async error(message, obj) {
    if (obj) {
      this.logger.log('error', message, { obj });
    } else {
      this.logger.log('error', message);
    }
  }
}

export { LoggerService };
If you desire to modify the log messages, you can easily achieve this by editing the return statement within the format attribute of the object inside the winston.createLogger() method. This provides a straightforward way to customize the content of your log entries through nodejs console logger.
For a more extensive adjustment of the log format, you can refer to the documentation or resources related to Winston docs. The flexibility of Winston allows you to tailor the log format to suit your specific requirements, providing detailed control over how information is presented in your logs. Explore the available options and tailor the log format according to your preferences.
4. Creating /logger POST API endpoint to test the logger
In the main folder, establish a file named “app.js” and insert the provided code:
import express from 'express';
const app = express();
import { LoggerService } from './services/loggerService.js';
import bodyParser from 'body-parser';
const { urlencoded, json } = bodyParser;
const logger = new LoggerService('app');

app.use(urlencoded({ extended: false }));
app.use(json());

app.post('/logger', (req, res) => {
  const body = req.body;
  let error = {};
  // Adding the body of the request as log data
  logger.setLogData(body);
  logger.info("Request received at /logger", req.body);

  // We are expecting userName, age, gender, and designation in the body of the request
  if (body.userName == null || body.userName == "") {
    logger.error("User name field is empty");
    error["userName"] = "userName field is empty";
  }

  if (body.age == null || body.age == "") {
    logger.error("Age field is empty");
    error["age"] = "age field is empty";
  }

  if (body.gender == null || body.gender == "") {
    logger.error("Gender field is empty");
    error["gender"] = "gender field is empty";
  }

  if (body.designation == null || body.designation == "") {
    logger.error("Designation field is empty");
    error["designation"] = "designation field is empty";
  }

  if (Object.keys(error).length !== 0) {
    logger.error("Return error response", { success: false, error });
    res.json({ success: false, error });
  } else {
    logger.info("Return success response", { success: true });
    res.json({ success: true });
  }
});

const PORT = 4000;

app.listen(PORT, () => {
  logger.info(`App listening on PORT ${PORT}`);
});
The provided code snippet defines a basic validation endpoint in the “app.js” file. This endpoint receives a JSON payload and performs a validation check to determine if any of the values are empty or null. Depending on the validation result, the endpoint responds with either “Error” or “No Error.”
{
    "userName": "",
    "age": 23,
    "gender": "Male",
    "designation": "SDE"
5. Running the Node Application and Testing the /test endpoint created
Execute the following command in your terminal to start the server:
node appUpon initiating the server, you will observe a log in the terminal. Additionally, you should find an “app.log” file inside the “logs” folder; the log entries displayed in the terminal are also stored in this file.
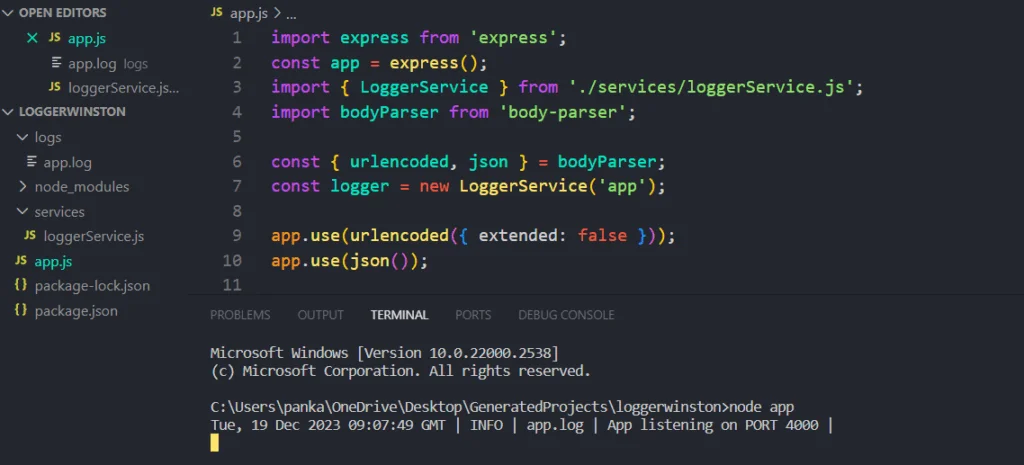
This dual logging mechanism provides a convenient way to access real-time information in the terminal while maintaining a persistent record in the log file for future reference or analysis. Adjust the log file names or paths as needed based on your project’s structure and requirements.
Testing the Endpoint
Now, proceed to test the endpoint using a testing tool; in this instance, Postman is utilized. Craft a request with the following JSON in the request body. Note that the userName attribute is intentionally left empty to trigger an error response, providing an opportunity to investigate the issue through the logs.
{
    "userName": "",
    "age": 23,
    "gender": "Male",
    "designation": "SDE"
}
This deliberately crafted request allows you to simulate a scenario where a required field (userName in this case) is empty, triggering the error handling mechanism. By examining the logs of nodejs console logger, you can gain insights into the nature of the error and pinpoint the source of the issue for effective debugging. Adjust the request payload as needed to test various scenarios and observe the corresponding log entries for thorough validation.
Configure the Postman request to match the specifications outlined in the provided image.

Following the configuration as depicted in Figure 4, send the request and examine whether the response contains an error message.
Subsequently, track the log file to pinpoint the exact error. Open the log file, which is likely named “app.log” based on the previous setup, and inspect the entries related to the recent request. The custom logger, configured with Winston, logs detailed information about the events, including error messages and timestamps. By analyzing these logs, you can gain valuable insights into the nature of the error, aiding in effective debugging and issue resolution.
Important Tip
Ensure to review the log entries for the specified timestamp corresponding to when the request was made. This approach facilitates a systematic investigation of the logs of nodejs console logger, allowing you to identify and address the specific issues encountered during the request. Adjust the request payload or simulate different scenarios to further explore the capabilities of the custom logger in tracking and handling errors.

If you’ve diligently followed the provided instructions, your output should resemble above image. The third log represents the error log, effectively allowing us to identify and understand the error through the logs.
Now, for further validation, modify the values in the request body JSON within Postman. Test different scenarios to verify if the corresponding logs are generated as expected. This process helps ensure that the custom logger is capturing relevant information for a variety of situations.
By iteratively adjusting the request payload and observing the logged entries in the file, you can thoroughly evaluate the logging functionality. This iterative testing approach is crucial for validating the effectiveness of the custom logger across diverse scenarios, enabling you to confidently rely on it for error tracking and debugging in your Node.js application.
Choosing between Winston, Morgan and Bunyan
Before choosing Winston for the logger, it is essential to understand the main differences between the available logging libraries. Morgan is designed as an HTTP request logger, which means that it comes as middleware in the Express ecosystem, while Bunyan is mainly focused on writing structured JSON logs. At the same time, Winston allows more flexibility in terms of logging levels and transport options, which is why it was chosen for this purpose in this project.
Another advantage of using Winston is that it allows more control over the final appearance of the logs, which is especially important if they are intended for human interpretation. The flexibility of Winston is manifested in the ability to choose what information to log, as well as the way of its representation, including the use of colors. With Morgan, a programmer is limited to the set of available options. This is also the reason why Bunyan is not the best choice if a custom logger is required.
Levels and Their Usefulness in Production Logs
Log levels matter more than many developers realize, especially in production. Winston has seven levels, ranging from error to silly, used to indicate how important a given message is.
In production, it’s best to disable verbose, debug, and silly levels — they generate too much noise for effective human review. Instead, enable info level and above in production, and reserve debug and lower levels for development environments.
This distinction matters most at scale. A high-traffic site can generate thousands of log entries daily. With the right level configuration, you can quickly surface important messages instead of digging through noise — and your team can react to error-level messages promptly instead of missing them in the flood of lower-priority logs.
The Next Steps for Improving Logging in the Project
The logger built in this guide is a solid starting point, but it’s best suited for smaller projects, since it writes everything directly to a local file. As your project grows, a few additions become worth considering.
Log rotation. This prevents log files from filling up your server’s storage. The winston-daily-rotate-file package handles this well, rotating logs daily and automatically removing old ones.
External logging services. Tools like Loggly, Datadog, or the ELK stack (Elasticsearch, Logstash, and Kibana) offer searching, analysis, and — importantly — real-time alerting. This means you can be notified the moment an error-level log appears, instead of manually checking logs after the fact. For production systems, this kind of real-time visibility is worth the investment.
Structuring Logs for Easy Debugging Across Codebase Growth
As an app grows beyond a single endpoint, one thing that helps debugging more than almost anything else is adding context tags to each log entry. This might include:
- Which module or service created the log
- A unique ID shared across all logs from the same request
- The specific function or route that triggered the log
Without this context, tracing what went wrong in a larger, multi-endpoint application becomes mostly guesswork — especially when your app is handling multiple concurrent requests, which is typical for anything serving real HTTP traffic.
Adding a unique request ID at the start of each request’s lifecycle, and including it in every log tied to that request, makes it much easier to follow a single request’s full path through your logs. It’s worth building this into your logger from the start, even before you strictly need it — retrofitting this kind of logging discipline later is significantly harder.
Common Logging Mistakes to Avoid
A few habits tend to undermine an otherwise solid logging setup:
- Logging too much at the wrong level. Overusing
infoordebugfor routine, low-value events buries the messages that actually matter. - Logging sensitive data. Passwords, tokens, or personal information should never end up in plaintext log files — this is both a security and compliance risk.
- Inconsistent log formatting. Mixing formats across different parts of the codebase makes logs harder to search and parse programmatically later.
- No correlation ID strategy. Without a shared request ID, tracing an issue across multiple services or function calls becomes far more time-consuming than it needs to be.
Conclusion
In conclusion, implementing a custom logger with Winston in a Node.js application equips developers with a robust tool for managing and analyzing nodejs console logger for custom logs efficiently. Winston’s flexibility and extensibility make it a valuable asset in ensuring effective monitoring, debugging, and overall system health. By tailoring the nodejs console logger to specific application needs, developers can gain granular insights into their code execution, enhancing the maintainability and performance of their Node.js projects.