

- 1 Powerful Data Visualization: D3. js hall specializes in making striking data-based graphics by binding data with DOM elements, and illustrating it by SVG, making the financial or healthcare data more communicative and powerful.
- 2 Seamless React Integration: Integrating D3' can be broken into two parts: The first part is the integration of the D3 community into the larger Buffalo community. js with React makes it possible for the developers to integrate the dynamic feature of D3. js due to its ability to make the user interface lighter through React’s advanced UI handling, or create robust and dynamic visuals for the new-generation web apps.
- 3 Customizable and Interactive: D3. js has comparatively high flexibility of graphic interface customizing features and interactivity including tooltip and animation, and that will be beneficial in developing status board or alike visual tools that can meet the individual’s customized and interactive business requirements.
In today’s data-driven world, effective data visualization is primary, enabling the conveyance of complex information in a simple way. Within the realm of custom financial software development, innovative approaches are demanded to represent complex financial data. One powerful tool for achieving this is D3.js (Data-Driven Documents). Renowned for its capability to create engaging and dynamic data visualizations, D3.js is a JavaScript library. In this blog post, we’ll delve into the realm of data visualization using D3.js. We’ll also explore how to smoothly integrate it with React. React is one of the most popular JavaScript toolkits which has been highly preferred as the means of development user interfaces.
Understanding D3.js: A Deep Dive
The D3.js, which stands for Data-Driven Documents, leverages the web developers such a way that they can easily customize, and manipulate data visualizations. At its core, D3.js is a tool that enables developers to map data on the DOM to a certain data and make data-driven transformations, which is an absolutely essential step for the creation of engaging and interactive visualizations. Data binding is critical to healthcare software, for in the case where the exact data representation is highly prized, it becomes a case of relevance of decisions taken. In this topic, D3.js helps in obtaining smooth data binding to DOM elements which also supports associating data with elements present in the document tree, thus making it easier for developers.
Before diving into the technical mechanics, it is important to contextualize why D3.js occupies such a unique position in the frontend ecosystem. When developers first encounter data visualization requirements, their immediate instinct is often to reach for high-level charting libraries like Chart.js, Highcharts, or Recharts. These libraries are fantastic for quickly rendering standard pie charts or line graphs with minimal configuration. However, the moment a project requires a highly bespoke visual representation—such as a custom interactive force-directed graph for mapping network topologies, or a complex sunburst diagram for hierarchical financial portfolios—these high-level libraries often hit a frustrating wall of limitations.
D3.js operates on an entirely different philosophy. Rather than providing pre-built, rigid chart components, it offers a suite of low-level mathematical and DOM manipulation utilities. It gives you the raw mathematical scales to translate your dataset into pixels, the geographic projections to render interactive maps, and the layout algorithms to calculate node positions. It does not draw a bar chart for you; instead, it gives you the exact tools needed to calculate the height, width, and position of every single rectangle based on your specific data array. This unopinionated, low-level approach results in an extraordinarily steep learning curve, but the payoff is absolute, limitless creative freedom. If you can imagine a visualization, D3.js provides the primitives to build it.
Data Binding and the DOM
D3.js, in turn, ensures a fast and seamless data binding process with the DOM elements, so that developers are able to set the direct connection of the data and a particular element in the document tree. Therefore, the easy readability of the information sparks the developers into the active creation of visual aids, such as charts, graphs, and maps.
Data-Driven transformations
Being a major characteristics of D3.js is definitely powerful in data –driven transformations in the field of healthcare. Data values are used by developers to competently change the visual properties of graphics allowing for real time changes to be shown and keeping the information accurate. This data driven strategy will be used to shave the visualizations that will be adaptive for the developers.
Scalable vector graphics (SVG)
Visual Data3JS utilizes Scalable Vector Graphics (SVG), which is a W3C standard for vector graphics, to save time and resources spent on creating visualizations that can be directly rendered within the browser. SVG in financial software development services has a special item- specific part of the service it provides as it provides the development of high-quality and resolution-independent graphics. With the freedom to incorporate SVG, an excellent tool that aims at creating graphics which will scale appropriately regardless of the devices/screen sizes involved, developers are able to fashion out amazing graphs /visuals that will work effectively regardless of the device/screen size. Thus, this method combines the world of art with technology, and as the result, we can see the improved visualization quality with relatively more freedom.
Interactivity and user engagement
Interactivity, as a key parameter of an approach to data visualization is a responsible force within custom enterprise software development. In this field of the software, D3.js is definitely the one that excels. With all the tools you could possibly need to add various dynamic functions, the software beats anyone in this regard. Developers can regularly put dynamic features into their visualizations like tooltips, zooming, panning, or animations. The result is not only the involvement of the users but also a qualified user experience. More than this particular aspect seems to be relevant only for mobile app user engagement among USA app developers, where user engagement is the main criterion for success. D3.js developers get a benefit of using this framework because they get the opportunity to have access to a large toolbox & utilities that allow them to build attractive visualizations and make narrative that will draw audience into contribution.
Extensibility and customization
D3.js offers exceptional flexibility and customization capabilities, making it ideal for custom software development companies. Developers can create bespoke visualizations tailored to their specific needs and requirements, whether they’re in banking software development or travel software development. From simple charts to complex data-driven applications, D3.js provides a flexible and universal framework for building custom visualizations that address a wide range of use cases. In custom software for business, the ability to customize visualizations according to unique business requirements is crucial for providing practical insights.
Understanding D3.js: Main Functions
- d3.select(): Selects the first matching element in the DOM based on the defined selector and returns a D3 selection object.
- d3.selectAll(): Selects all matching elements in the DOM based on the defined selector and returns a D3 selection object containing all matched elements.
- selection.data(): Using bind() creates new data joins selected elements are bound to. It makes a new choice which displays the new data combination and the consecutive operation process like enter update and exit are applied.
- selection.enter(): Replacements occupy spaces that data elements that have no parity with existing DOM elements, therefore, new elements can be added down the line.
- selection.append(): Appends a new element with the specified name as a child of each selected element, and returns a selection containing the newly appended elements.
- selection.attr(): establishes or changes the attribute value of an element that is chosen by each selected element.
- selection.style():Gets the value of specified CSS style property for all the elements that are selected or sets the value for them.
- selection.transition(): Creates a transition for the selected elements and returns a transition object that can be configured with desired animation effects.
- d3.scaleLinear(): Constructs a new linear scale with an input domain and output range. It maps input values to a continuous output range.
- d3.axisBottom(): Constructs a new bottom-oriented axis generator with default settings. It generates an axis with tick marks and labels for the bottom of a chart.
- d3.axisLeft(): Constructs a new left-oriented axis generator with default settings. It generates an axis with tick marks and labels for the left side of a chart.
- d3.max(): Returns the maximum value in the given array using natural order.
- d3.transition(): Returns a new transition on the given selection.
Guide to Integrate D3.js with React
1. Install D3.js and React:
First, make sure you have D3.js and React installed in your project. You can install them via npm or yarn:
1 | npm install d3 react react-dom |
or
1 | yarn add d3 react react-dom |
2. Create a React Component:
Create a new React component where you’ll integrate D3.js. This component will serve as the container for your D3.js visualization.
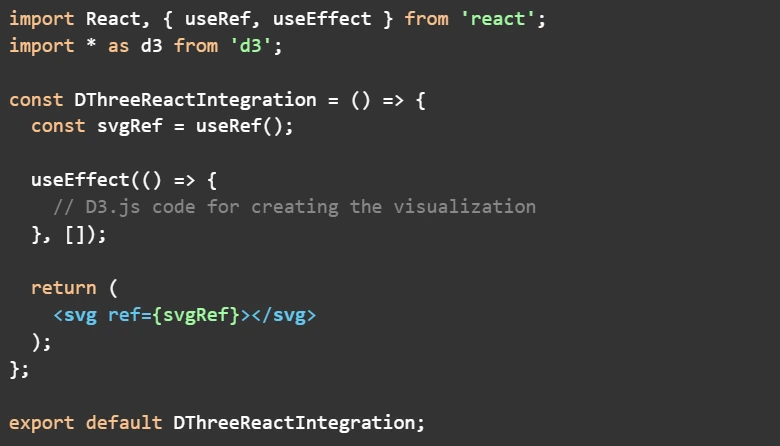
3. Initialize D3.js Visualization in useEffect():
Inside the useEffect() hook of your component, initialize the D3.js visualization logic. This is where you’ll create your visualization using D3.js code.
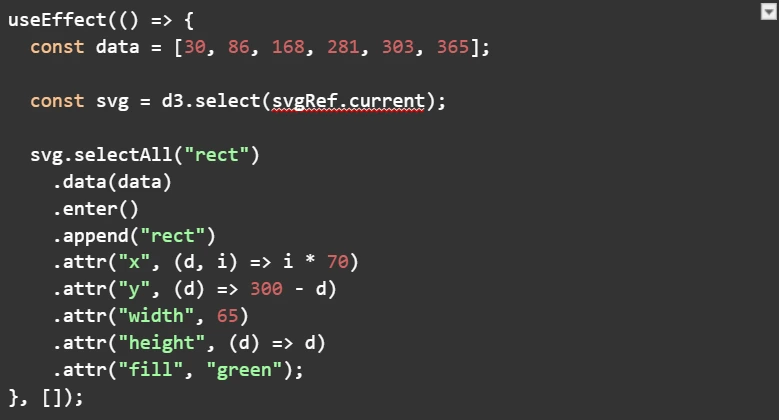
In this example, we’re creating a simple bar chart using D3.js. You can replace this code with any D3.js visualization logic based on your requirements.
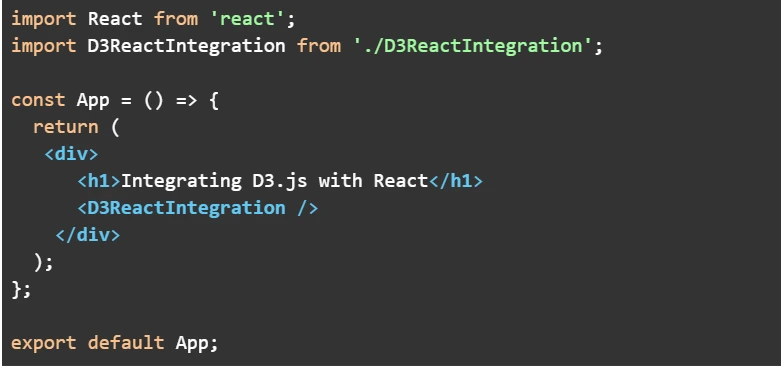
4. Render the Component:
Finally, render your React component where you want to display the D3.js visualization.
5. Run Your React App:
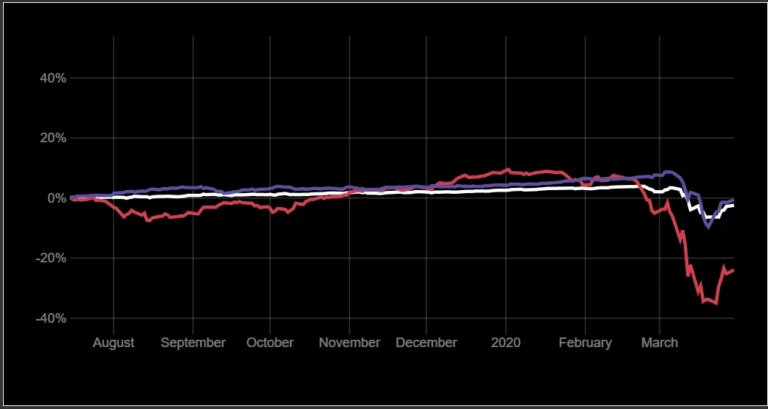
Start your React development server to see the integrated D3.js visualization in action.
1 | npm start |
Or
1 | yarn start |
While the implementation steps above outline the basic workflow, integrating D3.js and React in a production environment introduces a fascinating architectural challenge. The core tension stems from the fact that both React and D3.js inherently want total control over the DOM. React relies on its Virtual DOM reconciliation algorithm to efficiently calculate and apply UI updates. D3.js, conversely, expects to directly select DOM nodes, bind data to them, and manually mutate their attributes over time (especially during complex animations and transitions).
If you blindly allow both libraries to manipulate the same elements, you will quickly encounter severe rendering bugs. React might unmount an SVG group that D3 is currently trying to animate, or D3 might append elements that React’s Virtual DOM is completely unaware of, leading to out-of-sync UI states. To resolve this conflict, the industry has largely settled on two primary integration patterns.
The first pattern, which is demonstrated in the basic guide above, involves giving D3.js absolute control over a single, isolated container. By creating a blank SVG element and attaching a React useRef to it, you can tell React to completely ignore the contents of that specific node. Inside your useEffect hook, D3.js takes over, selecting that referenced node and freely manipulating everything inside it. This is generally the easiest approach when migrating existing vanilla D3.js code into a React application, as it preserves the standard D3 workflow, including its powerful transition engine.
The second, more “React-way” pattern involves using D3.js strictly for its mathematical utility functions while letting React handle all actual DOM rendering. In this paradigm, you use D3.js to calculate the scales, generate the complex SVG path data strings, and determine exact X/Y coordinates. You then take those calculated values and pass them directly into standard JSX elements. This approach keeps the Virtual DOM perfectly in sync and aligns beautifully with React’s declarative nature. However, it completely sacrifices D3’s built-in transition and animation capabilities, meaning you will need to rely on external animation libraries like Framer Motion or React Spring to handle complex visual interpolations.
Conclusion
Among others, it is a complete arsenal of data-driven components, which can be dynamically engaged and graphically processed. With the help of the instructional sessions, developers will get an idea of the principles working behind the software and its innovative feature set allowing those people who already directly deal with the system to expand their skills to the maximum scope. They can figure out how to utilize the power of data to deliver experience that is full of action, make the user engage and create thirst for knowledge.
A powerful tool can be found in (D3.js) with regard to its ability to rapidly produce, effectively manage and evolve very attractive data visualizations. Given the correct circumstances, the (D3.js) robust framework integrates seamlessly with React, a luxury framework for establishing user-friendly interfaces. By essential the two libraries of React and D3.js, developers can collapse the strengths of both libraries and produce applications which appeal to data-centric audiences. No matter whether the role is in simplifying complex datasets or constructing interactive dashboards, a union of D3.js and React medicalizes an immense area of creating involving end-users.